Resource Conservation and Recovery Act (RCRA) Sampling
02/28/26
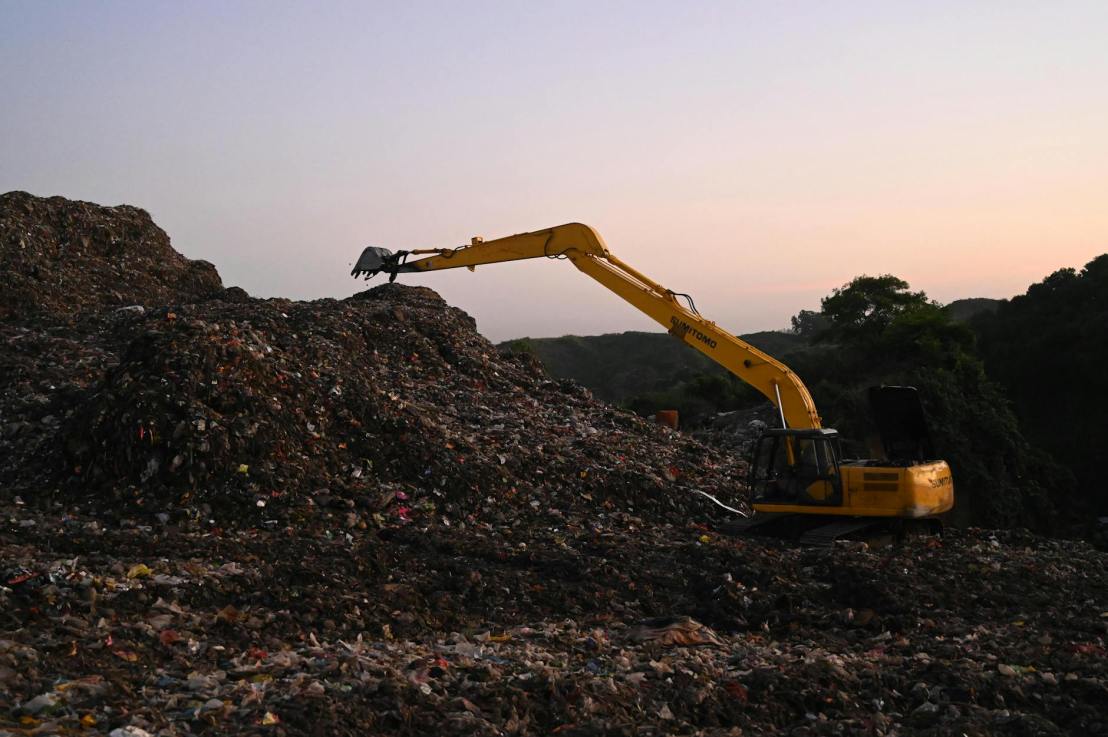
“How do we sample waste to make sure it isn’t hazardous?”
Proper waste disposal is important for keeping the local environment clean. Under the US Resource Conservation and Recovery Act (RCRA), waste generators must determine if their waste is hazardous. If there’s uncertainty about the waste composition, then waste generators must take samples to labs to determine if the waste is ignitable, corrosive, reactive, and/or toxic. Because waste samples can vary widely in contaminants, the waste generator must apply statistical sampling procedures. This means determining the mean, standard deviation, probability of detecting contamination if it truly exists, confidence that our conclusion is correct, the smallest difference from the regulatory standard that we want to detect, and the number of samples needed. Resource Conservation and Recovery Act (RCRA) Sampling is a vital part of determining waste hazards in the U.S.